Click Learning Journeys from your menu bar.
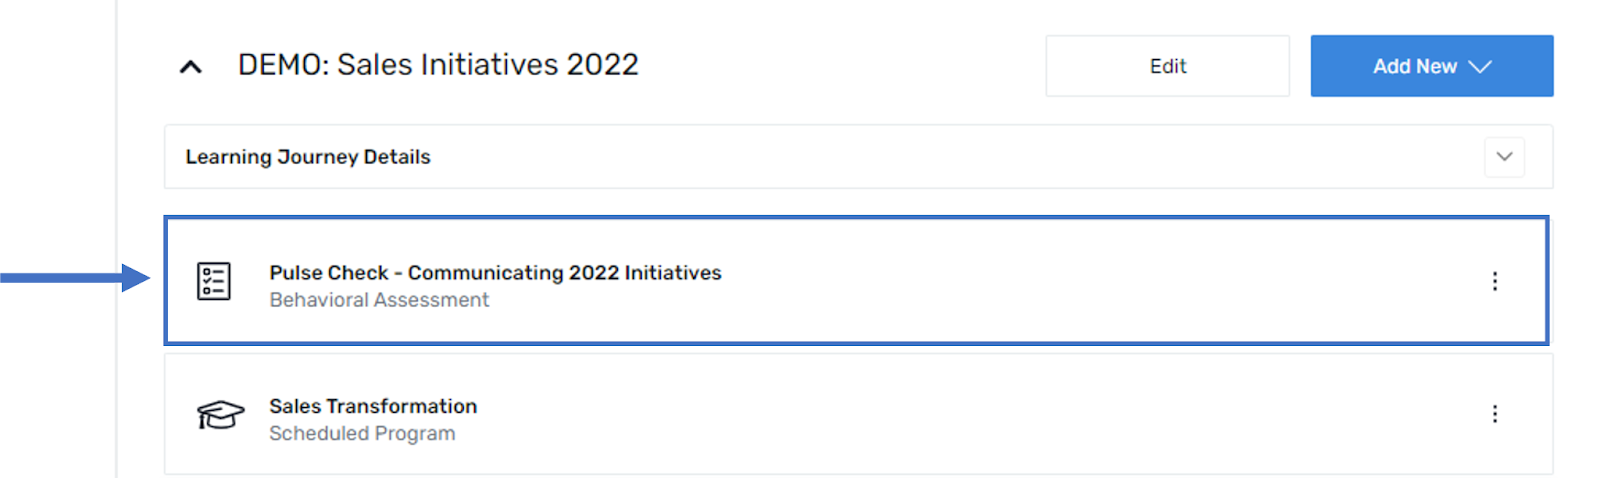
Select the behavioral assessment you wish to analyze from the list of programs.
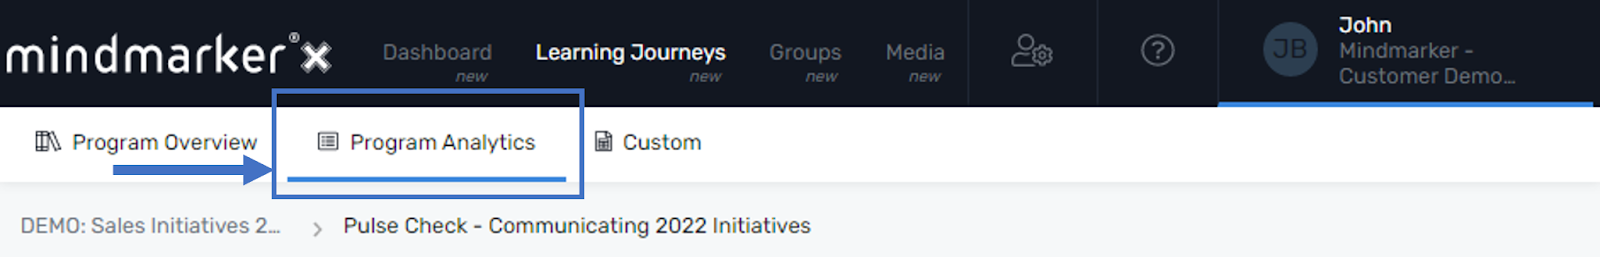
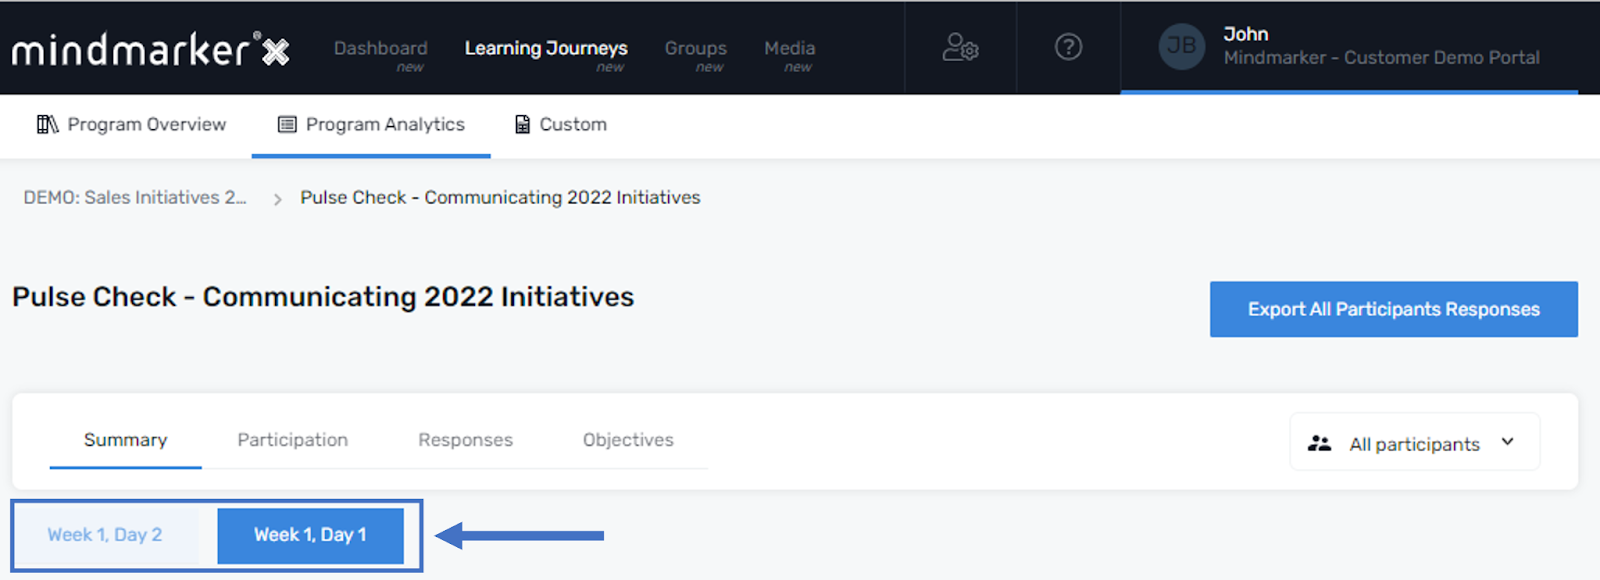
Click on Program Analytics. The analytics module will open directly to the Summary tab.
The Participation tab provides an overview of participant status. If a behavioral assessment has been repeated, each instance can be selected individually.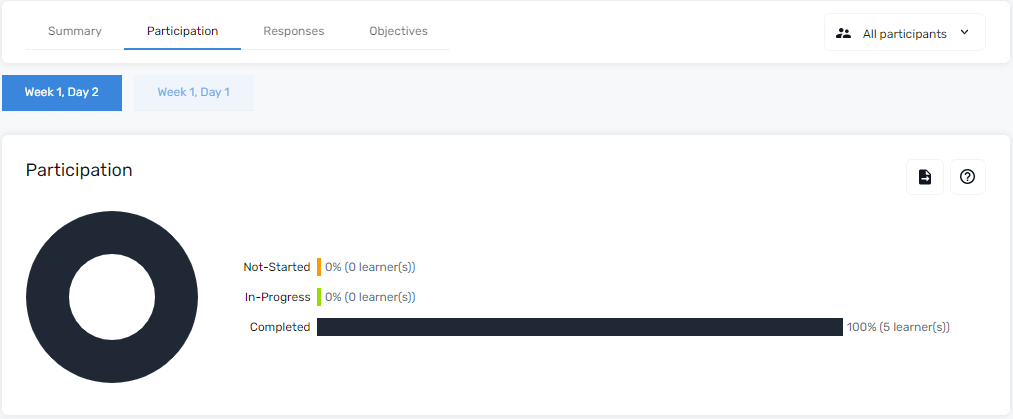
In addition to providing an overview of all learners’ status, a table of all individual results is made available. This table can be searched, sorted, filtered, and exported to support your specific needs.
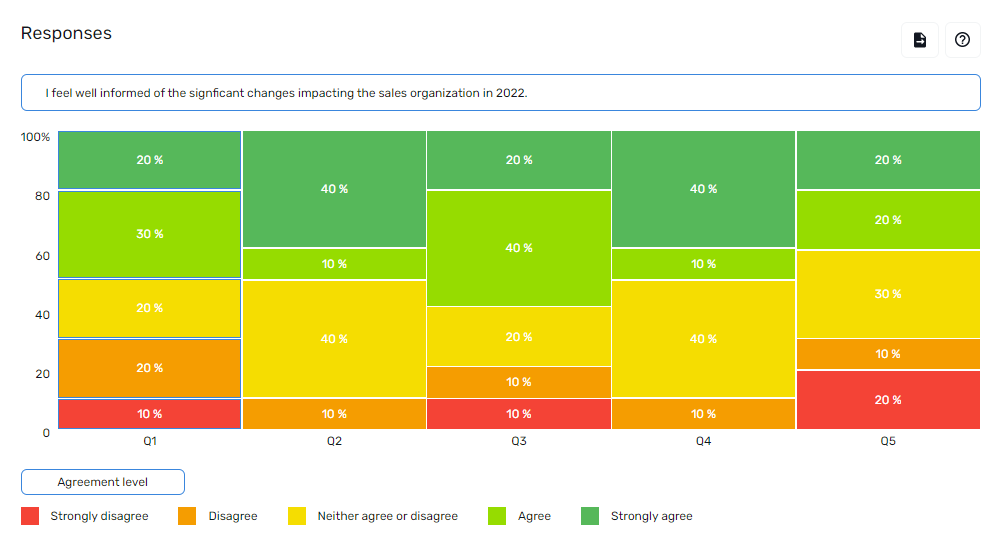
In Responses, an overview is provided showing both the average learner response as well as the distribution of responses.
From the drop-down list, you may select either an individual question or view data for all questions in the assessment (‘All results’). If a given behavioral assessment has been repeated, the average and distribution for all instances will be shown to enable efficient comparison. 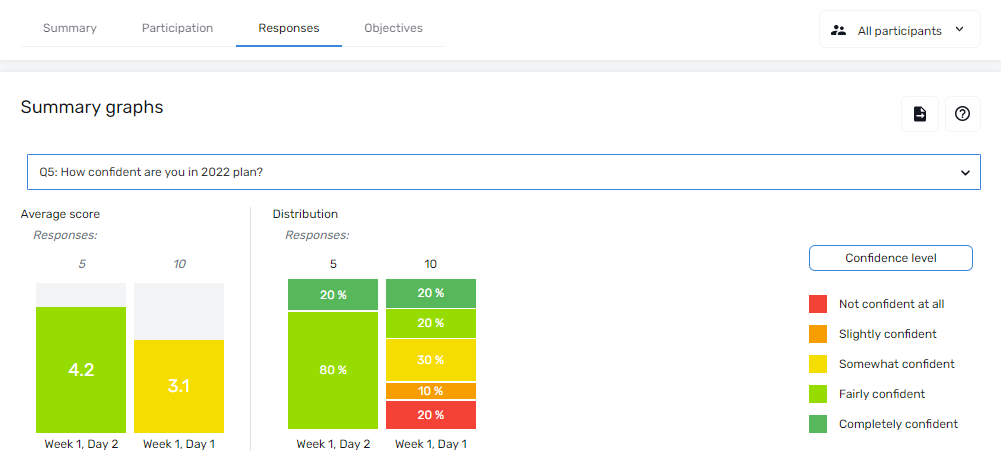
In the example graph below, learners have completed the assessment on two different dates. In the first instance, 20% of respondents indicated they were ‘Not confident at all’ in their knowledge of the 2022 plan, and only 40% were ‘Fairly confident’ or ‘Completely confident.’ When asked at a later date, 100% were ‘Fairly confident’ or ‘Completely confident.’
This very positive overall shift is reflected in the average response scores. When initially asked, the average was 3.1. This improved to 4.2 when asked at a later date. As a reminder, scores are calculated by converting responses to a 5-point scale with the least positive response (e.g. ‘Not confident at all) given a ‘1’ and the most positive response (e.g. ‘Completely confident’) given a ‘5’).
The Responses tab also contains a table of individual learner responses that can be searched, sorted, filtered, and exported to support your specific needs.
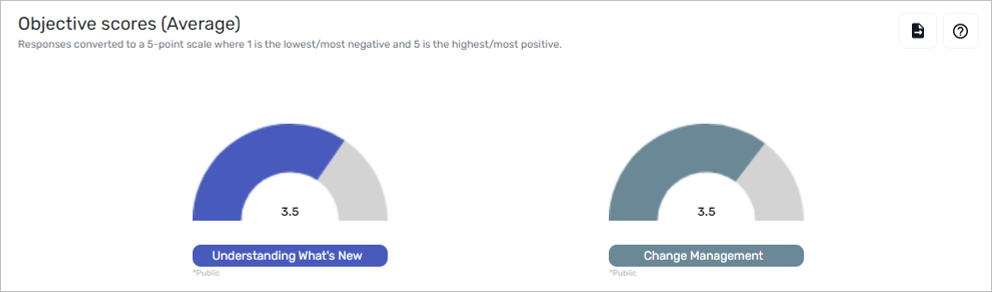
As in the summary tab, Objectives provide an average value for each learning objective in the assessment.
As a reminder, to calculate an average, each response is converted to a 5-point scale where the least positive option (e.g. ‘Strongly disagree’) is given a one, and the most positive response (e.g., Strongly agree’) is given a 5.
Additionally, results for individual questions tagged with a given Objective are made available under Details. Choose the desired Learning Objectives from the drop-down menu. Hover over each question to see the full question title.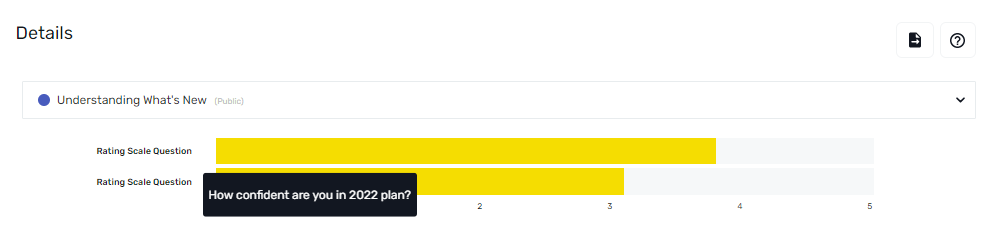
In all tabs, results can be filtered by groups. The default group is All participants; select the desired group from the drop-down list to update.